Debugging
Less than 1 minute
Debugging
Debugging a web application is essential when fixing errors or trying to understand how the code works.
In this topic we will describe 2 possible ways of debugging Angular applications:
- Chrome DevTools
- VS Code
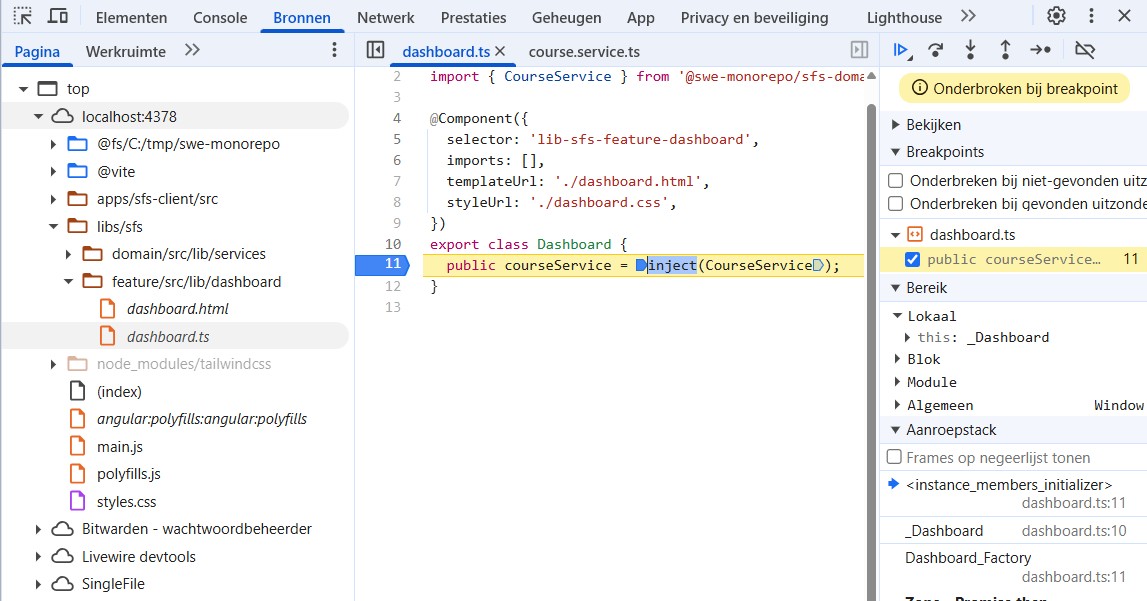
Chrome DevTools
- Open the Chrome DevTools (
F12) - Go to
Bronnen(Sources) - Search in the list for your
appsandlibs - In this example: find the
libs/sfs/feature/src/lib/dashboardfolder - Find the
TypeScriptfile you want to debug and open it - Set breakpoints and start debugging
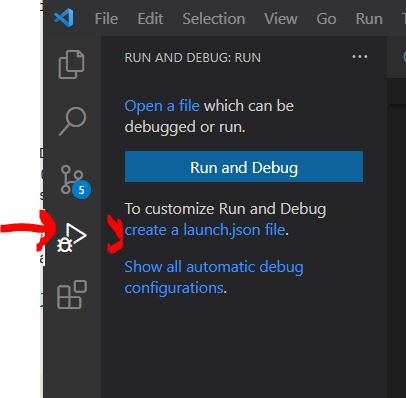
VS Code
- Open VS Code and search for the debug icon in the left menu
- Click on it and choose for
create a launch.json file - Choose Web App (Chrome) as browser
vs code debugging - Add the following content to the
launch.jsonfile:
{
  // Use IntelliSense to learn about possible attributes.
  // Hover to view descriptions of existing attributes.
  // For more information, visit: https://go.microsoft.com/fwlink/?linkid=830387
  "version": "0.2.0",
  "configurations": [
    {
      "type": "chrome",
      "request": "launch",
      "name": "Launch Chrome against localhost",
      "url": "http://localhost:4378",
      "webRoot": "${workspaceFolder}"
    }
  ]
}
Make sure to change the
urlto thelocalhost urlof the web applicationRun the application (
npm start,ng serve)Launch the debugger
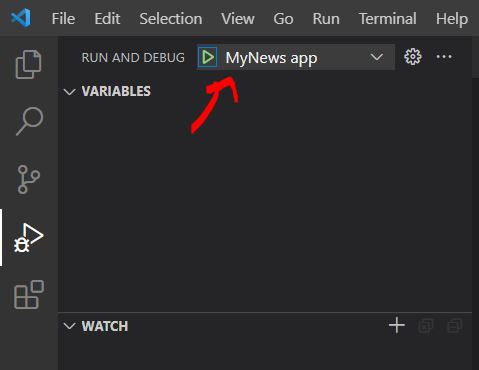
vs code debugging launch Add some breakpoints and start debugging
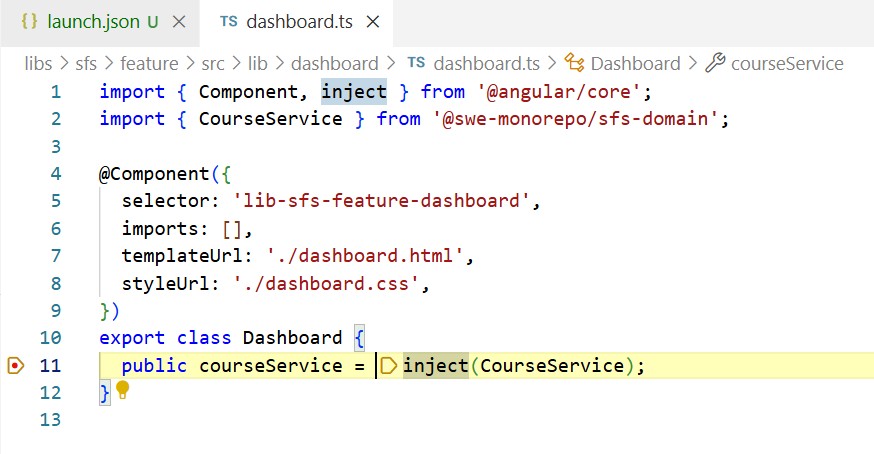
vs code debugging breakpoints